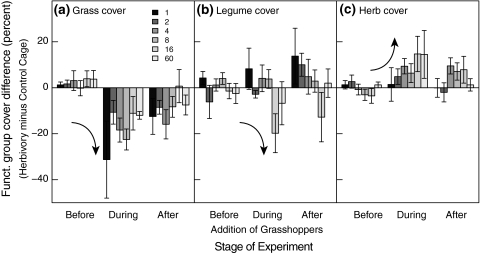
Fig. 3.
Differences in a grass, b legume and c herb cover between herbivory and control cages. Each panel shows the combined effects of experimental stage (before, during and after addition of grasshoppers) and plant species richness. Low (high) plant species richness is indicated by dark (light) shading of bars. Negative differences indicate lower functional group cover in herbivory than in control cages. Curved arrows indicate the main direction of changes after grasshopper addition. Error bars show ±1 SE of the mean. Grass cover: n = 44; legume cover: n = 43; herb cover: n = 64

