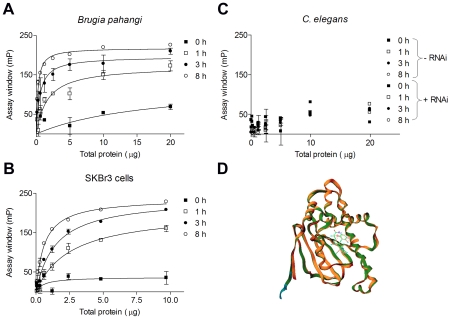
Figure 1. Brugia assay development.
(A–C) Dose-response curve for the binding of 6 nM cy3B-GA to Hsp90 present in the adult Brugia pahangi worm extract (A), SKBr3 cell lysate (B) and C. elegans extract (-RNAi) or to a C. elegans extract in which hsp90 had been depleted by RNAi by approximately 40% (+RNAi) (C) Various amounts of total lysate protein dissolved in binding buffer (0–20 µg/well) were incubated in triplicate wells with the ligand at 4°C, and the response was measured at the indicated time intervals. Fluorescence polarization was read with an Analyst GT instrument. Values obtained at several time intervals were plotted against the amount of added total protein. The assay window data were obtained by subtracting free tracer values from values recorded in the presence of specified protein concentrations. Data were analyzed and plotted in Prism 4.0. Points, mean; bars, s.d. (D) Overlay of GA-bound homology models (derived using Prime software of Schrodinger L.L.C, NY) of B. pahangi (orange, Accession number AJ005784) and C. elegans (green, Accession number Z75530) and the X-ray crystal structure of human Hsp90α (blue, PDB ID: 1YET).

