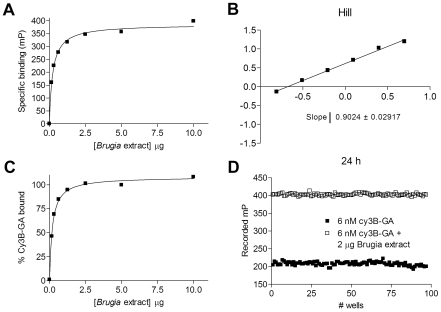
Figure 2. Analysis of Brugia assay performance.
(A–C) Data collected at equilibrium in the binding experiment described in Fig1A were transformed and analyzed using a nonlinear regression method in Prism 4.0, and Hill plots were constructed. Specific binding represents the contribution of bound ligand to total recorded values. (D) Two 96-well plates each containing 48 free tracer control wells (6 nM cy3B-GA) and 48 bound tracer control wells (6 nM cy3B–GA with added lysate, 2 µg/well) were used to determine the suitability of the assay for high-throughput screening. The millipolarization value for each well was recorded, and average values corresponding to each plate were plotted. The signal-to-noise ratios and the Z' factors were calculated as indicated in Methods.

