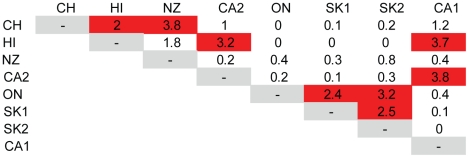
Figure 3. Similarity matrix showing the presence of significant overlaps in protein expression between populations.
Data shown is the representation factor where >1 indicates more overlap than expected between two populations. Statistical significance of this overlap was determined by applying an exact hypergeometric test (red indicates P<.05).

