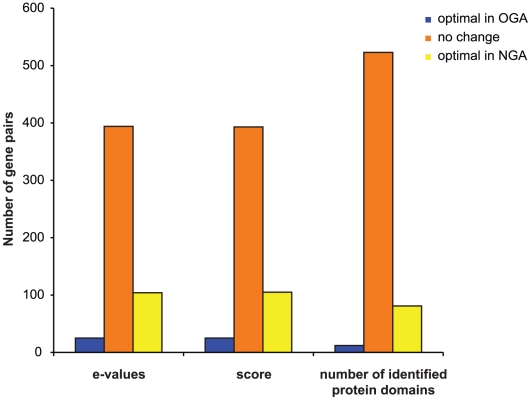
Figure 2. Structural annotation improvement in the new E. histolytica assembly.
Comparative analysis of Pfam HMM searches statistics between equivalent genes in the old and new annotation. Blue bars, genes that have better statistics/hits in the old annotation compared to the new annotation; orange bars, old and new annotation genes give exactly the same result; yellow bars, number of genes from the new annotation with better statistics/hits compared to their counterparts in the old annotation.

