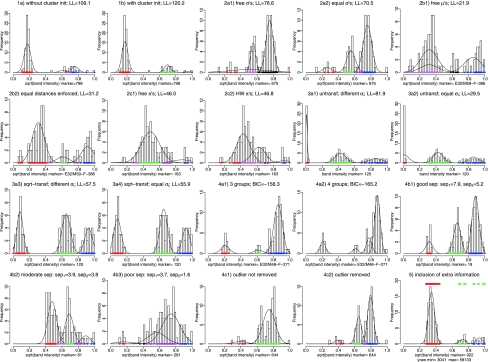
Fig. 3.
Examples of features helping unmixing of marker intensities for the tomato data. Subplots 1a–b deal with starting values of parameters; 2a1–a2 restriction on σ: hetero- versus homoscedasticity; 2b1–b2 restriction on μ: equidistant component means; 2c1–c2 HWE restriction on π; 3a1–a4 transformation of band intensity; 4a1–a2 number of components of mixture model; 4b1–b3 separation of group means; 4c1–c2 outliers; five extra information in plot

