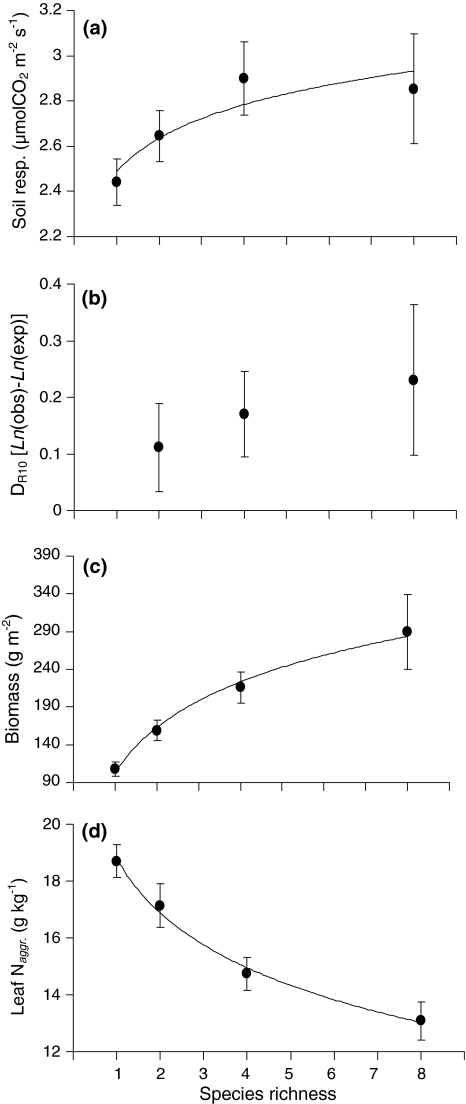
Fig. 2.
Relationships between species richness and a soil respiration, b deviation from expected soil respiration based on monocultures (D R10), c aboveground biomass, and d average community leaf N concentration (N aggr.). Except for D R10, each of the variables showed a significant relationship with species richness. See text for details. Means ± SEs are shown

