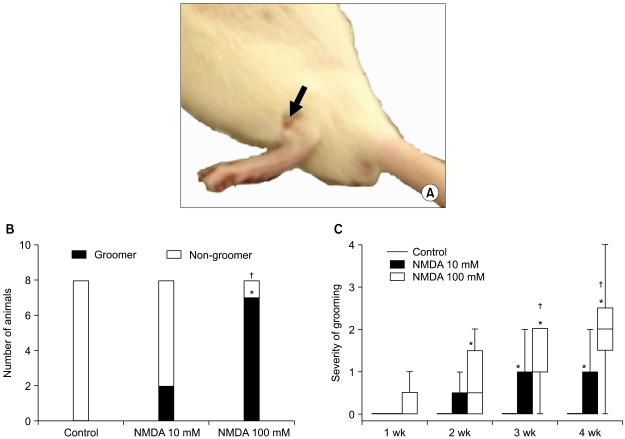
Fig. 2.
Excessive grooming behaviors. (A) An example of phase II grooming targeted dermatome at the injection site in a 100 mM NMDA injected rat is demonstrated (black arrow). (B) The number of animals that developed excessive grooming behavior was significantly higher in the 100 mM NMDA group than those values in the 10 mM NMDA or the sham operated control groups. (C) The severity of excessive grooming in the animals of the 100 mM NMDA group was higher than those values of control and 10 mM NMDA group. In (C) boxes show interquartile ranges and the bars are the 10th and 90th percentiles. *P < 0.05 compared with control group. †P < 0.05 compared with 10 mM NMDA group.

