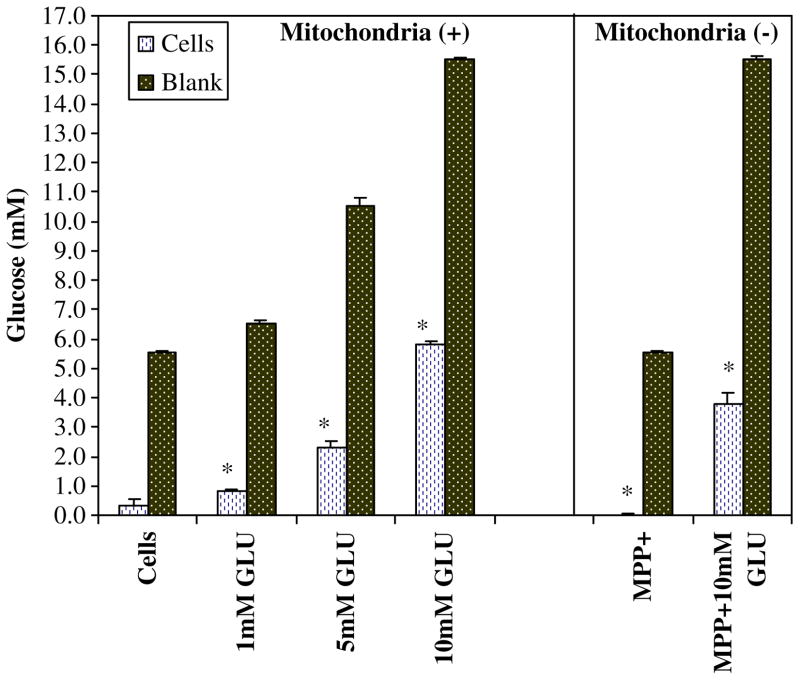
Fig. 2.
Variation in glucose utilization patterns by N-2A cells was examined after treatment with glucose (1–10 mM) in the presence or absence of MPP+ for 24 h at 37°C. Glucose concentrations within the experimental plating media were 1,000 mg/L. The data represent millimolar glucose as determined by glucose oxidase peroxidase-linked reaction. The data are expressed as the mean ± SEM (N=4), and statistical differences between glucose were utilized by [cells controls vs. MPP+] and [10 mM GLU vs 10mM GLU + MPP+] were determined by Student’s t test, *P<0.05

