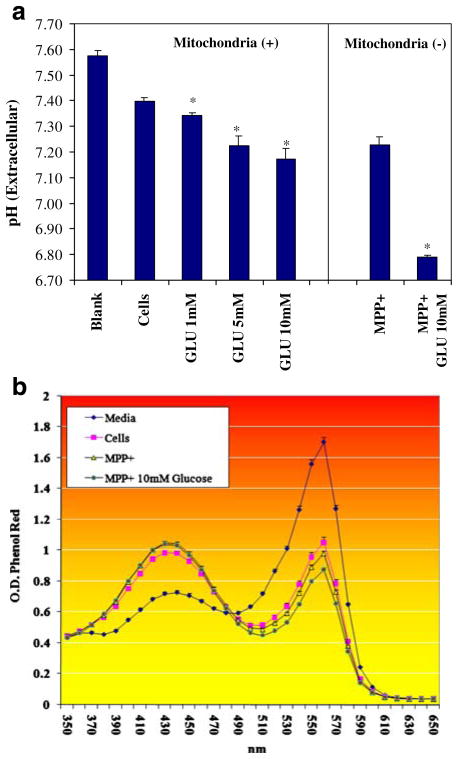
Fig. 3.
a Extracellular pH(ex) was evaluated in N-2A cells after treatment with variation in glucose concentration in the presence or absence of MPP+ after 24 h at 37°C. The data represent pH and are expressed as the mean ± SEM (N=4). Statistical differences from controls were determined by a one-way ANOVA followed by a Tukey post hoc test and Student’s t test for the MPP+-treated groups. *P<0.05. b Extracellular pH (ex) was evaluated in N-2A cells after treatment with variation in glucose ±MPP+ after 24 h at 37°C. The data represent the OD of phenol red indicator dye over 350–650 nm. The data are expressed as the mean±SEM (N=4)

