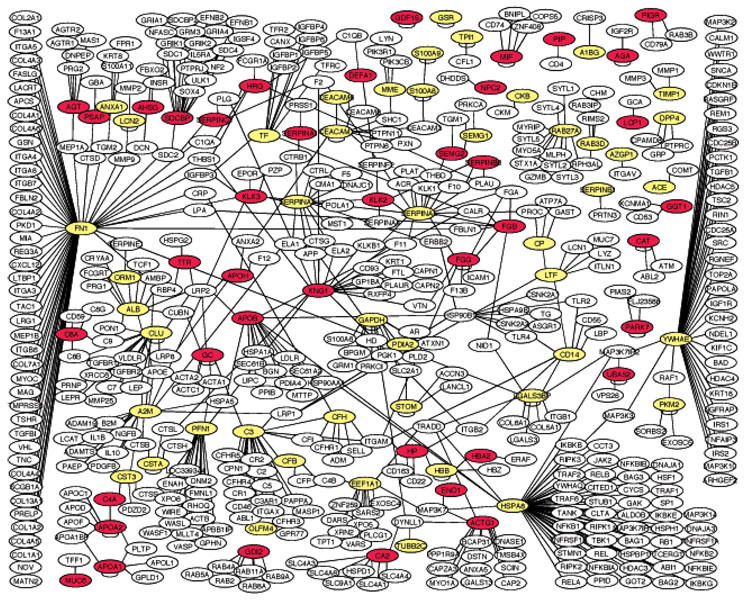
Figure 1.
A protein–protein interaction network of the EPS proteins. Colored (yellow and red) nodes indicate the EPS proteins that we identified by MS. Noncolored nodes are derived from the human protein–protein interaction databases of HPRD and NCBI. We only retrieved proteins that interact with an EPS protein, i.e., only one-step retrieval of the protein–protein interaction. We only showed the large network connecting most of the EPS proteins. Smaller networks and isolated nodes were not shown. The red color also indicates the nodes with microarray data from the Oncomine database suggesting that they are upregulated in prostate cancer cells.

