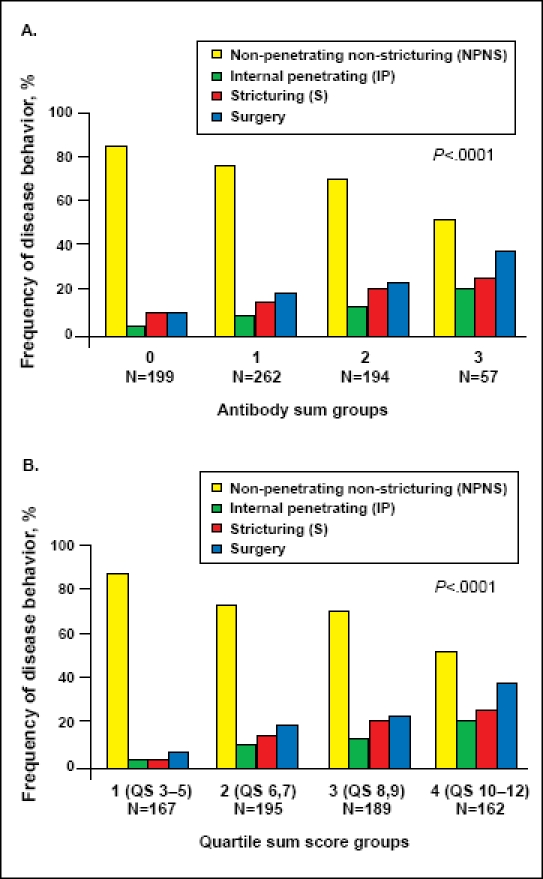
Figure 2.

(A) Frequency of NPNS, IP, S, and surgery among the different antibody sum groups. Sum calculated based on the presence or absence of anti-CBir1, anti-OmpC, ASCA, and pANCA. P trend <.0001. (B) Frequency of NPNS, IP, S, and surgery among the different quartile sum score groups; P trend <.0001.
Reproduced with permission from Dubinsky et al.59
