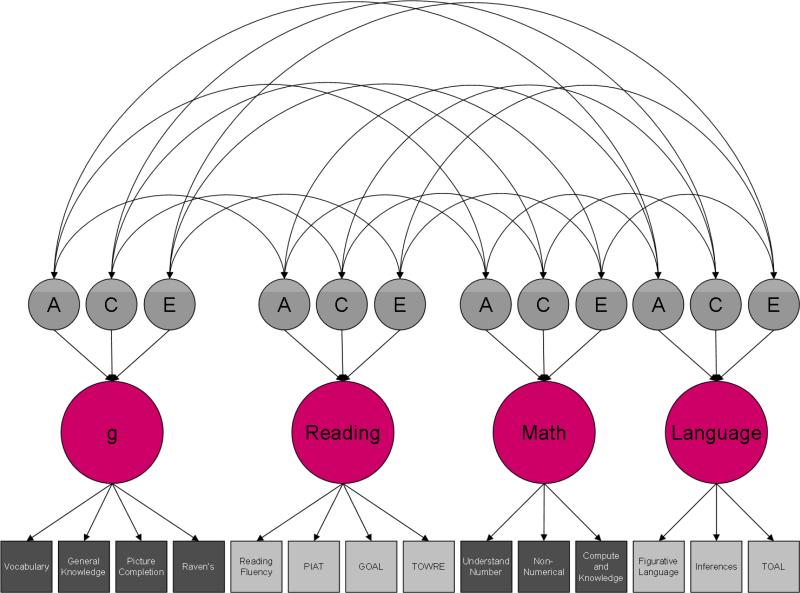
Figure 1. Common pathway model.
A = Additive genetic effects; C = Shared (common) environmental effects; E = non-shared environmental effects. Squares represent measured traits; circles represent latent factors. The lower tier of arrows represents factor loadings; the second tier represents genetic and environmental path coefficients; the curved arrows at the top represent correlations between genetic and environmental latent factors.

