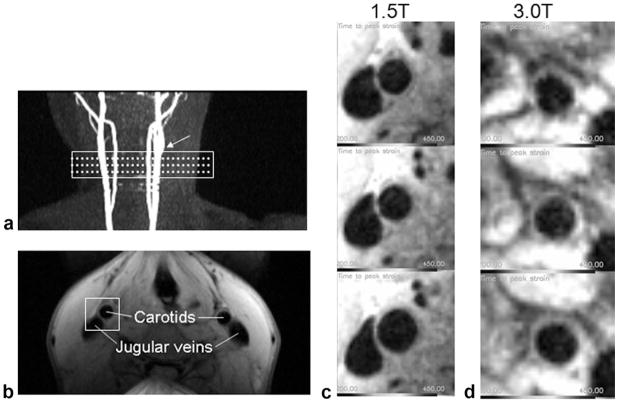
FIG. 4.
DENSE MRI. a: Slice locations (dotted lines) and shim volume (rectangle) of the DENSE and CINE MRI are indicated on maximum intensity projection images of 2D TOF MRI. Arrow indicates the carotid bifurcation used as a landmark. b: Raw DENSE phase image acquired at 1.5T. The rectangular volume indicates the area that is postprocessed using the DENSEview software. c: Three slices of the DENSE MRI acquired at 1.5T starting at the top from the inferior portion of the common carotid to just below the bifurcation. d: Three slices of the DENSE MRI acquired at 3.0T in the same order.

