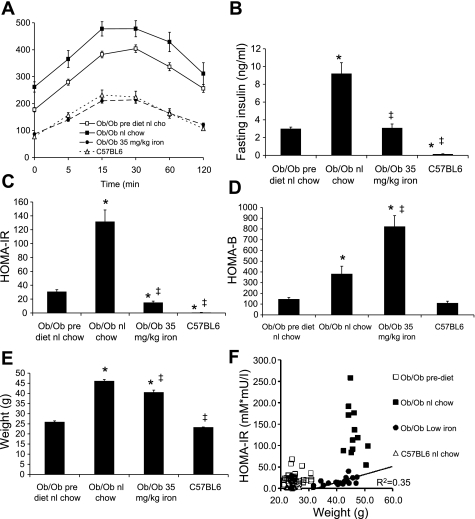
Fig. 1.
Glucose tolerance and weights in mice fed normal (nl) chow or a low-iron diet. Intraperitoneal glucose tolerance testing was performed on ob/ob mice on nl chow at age 4–6 wk, after which time they were maintained on that diet or placed on a lower-iron diet (35 mg/kg). The mice were retested 4 wk later. Wild-type C57BL6 mice, the background strain of the ob/ob mice, were also tested at the same age, 8–10 wk. A: results of intraperitoneal glucose tolerance testing. B: fasting insulin levels. C: homeostasis model assessment of insulin resistance (HOMA-IR). D: homeostasis model assessment of β-cell function (HOMA-B). E: weights of the mice at the 2nd glucose tolerance test. F: values for HOMA-IR were plotted as a function of weight for the individual mice studied. The relation of HOMA-IR to weight for the ob/ob mice on low iron was significant (r2 = 0.35, P = 0.006), but there was no such relationship for the ob/ob mice on higher iron. Shown are means ± SE; n = 12–20/group. In A, all glucose values differ significantly among the 3 groups of ob/ob mice; P < 0.001. In B and C, *P < 0.01 compared with prediet levels in the ob/ob mice on normal chow; ‡P < 0.01 compared with ob/ob mice on normal chow.

