
Figure 3.
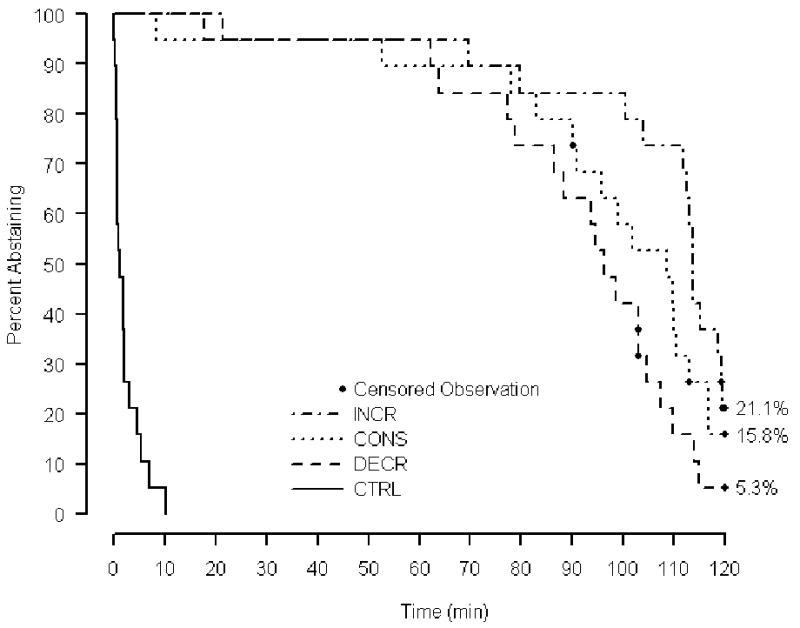
Abstinence-survival curves per condition. Time into the model-of-relapse session is plotted on the horizontal axis and percentage of participants still abstaining is plotted on the vertical axis. Ultimate survival percentages are shown. Censored observations (see text for description) are noted.