
Figure 1. The MLL PHD3 finger binds histone H3K4me3.
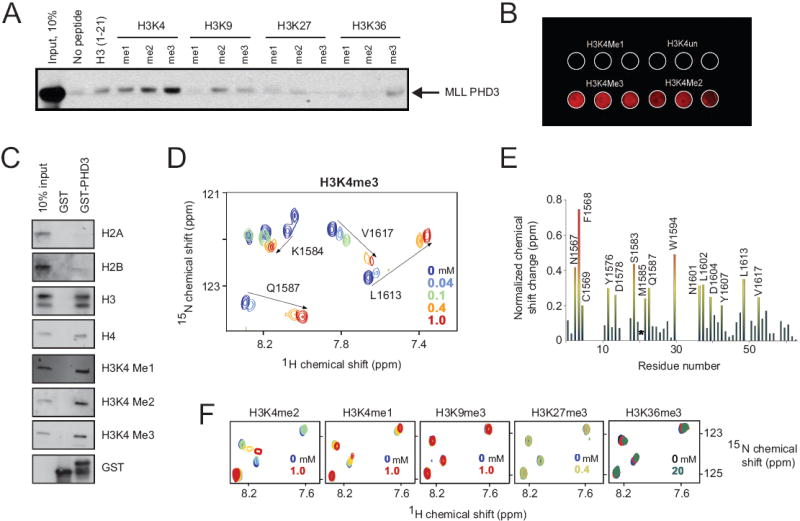
(A, B) Immuno-detection (anti-GST antibody) shows binding of GST-PHD3 to the indicated biotinylated histone peptides in a peptide pull-down assay (A) and peptide microarray (B). (C) Western blot using antibodies to the indicated epitopes shows binding of GST-PHD3 to a calf thymus histone mixture. (D, F) Shown are superimposed 1H, 15N HSQC spectra of 0.2 mM PHD3, collected while the indicated histone peptides were titrated in. The spectra are color-coded according to the peptide concentrations (inset). (E) The histogram displays normalized 1H, 15N chemical shift changes observed in backbone amides (or the side chain of W1594) in the corresponding (D) spectra of the PHD3 finger. Colored bars indicate significant change being greater than an average plus one-half standard deviation. Asterisk indicates loss of M1585 resonance.