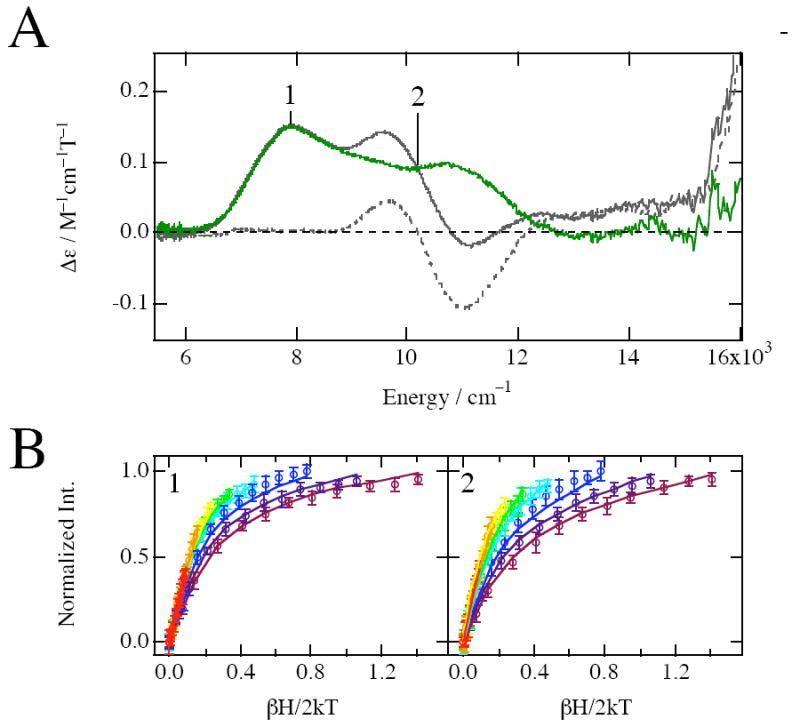
Figure 2.

Ligand field MCD and VTVH MCD data for resting NDO with oxidized Rieske. (A) MCD spectra at 5K and 7T of resting NDO; FeNDOox (gray line), apoNDOox (gray dashed line), and the difference (FeNDOox – apoNDOox) (dark green line) spectra. (B) VTVH saturation magnetization behavior of resting NDO with oxidized Rieske measured at 7810 cm−1 (1) and 10200 cm−1 (2). The normalized data are plotted vs βH/2kT for a series of fixed temperatures (1.7, 2, 3, 5, 7, 10, 15, 25K). The temperature of isotherm curves increases as the color of curves changes from purple to red in the spectral color order. Errors in the intensities are also shown by error bars. The best fit (solid lines) to the data was generated by the parameters described in Table 1.
