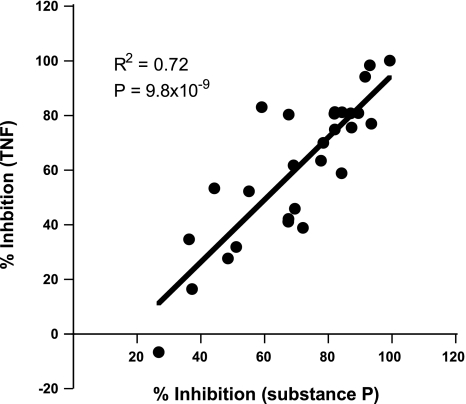
Fig. 2.
Correlation between inhibition of IL-8 production induced by substance P and TNF-α (TNF). Percent inhibition of substance P-induced vs. TNF-induced IL-8 production is shown as a scatter plot, with each point representing results from a compound in Table 1.

