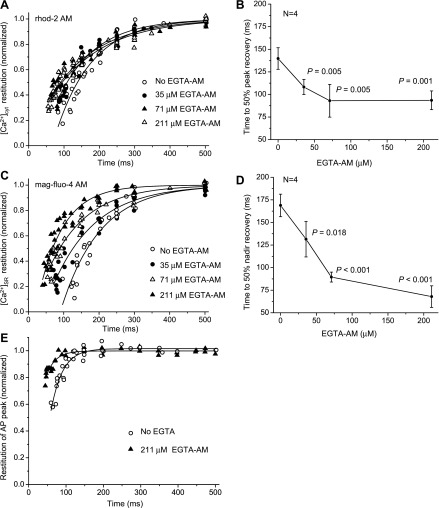
Fig. 11.
Restitution of Ca2+ transients in the cytosol (A and B) and SR lumen (C and D) obtained at several EGTA AM concentrations in the loading solution. Ca2+ transients were recorded at 37°C and at a pacing frequency of 2 Hz using rhod-2 AM (A and B) and mag-fluo-4 (C and D) as fluorescent Ca2+ indicators. Data were collected separately for each indicator during four independent experiments at different EGTA AM concentrations. Data in B and D are means ± SD. The total number of animals used was 32 animals; N is the number of animals used for each variant. P values are the results of one-way ANOVA (no EGTA AM vs. different concentrations of EGTA AM). E: time course of the restitution of the AP in the presence and absence of EGTA AM. The restitution of the AP was calculated as changes in the amplitude of the spike. Measurements were conducted using the potentiometric dye di-8-ANEPPS on mouse hearts perfused with 7.5 μM blebbistatin to prevent movement artifacts (37°C, 2 Hz). Data were collected during three to four independent experiments for each condition.

