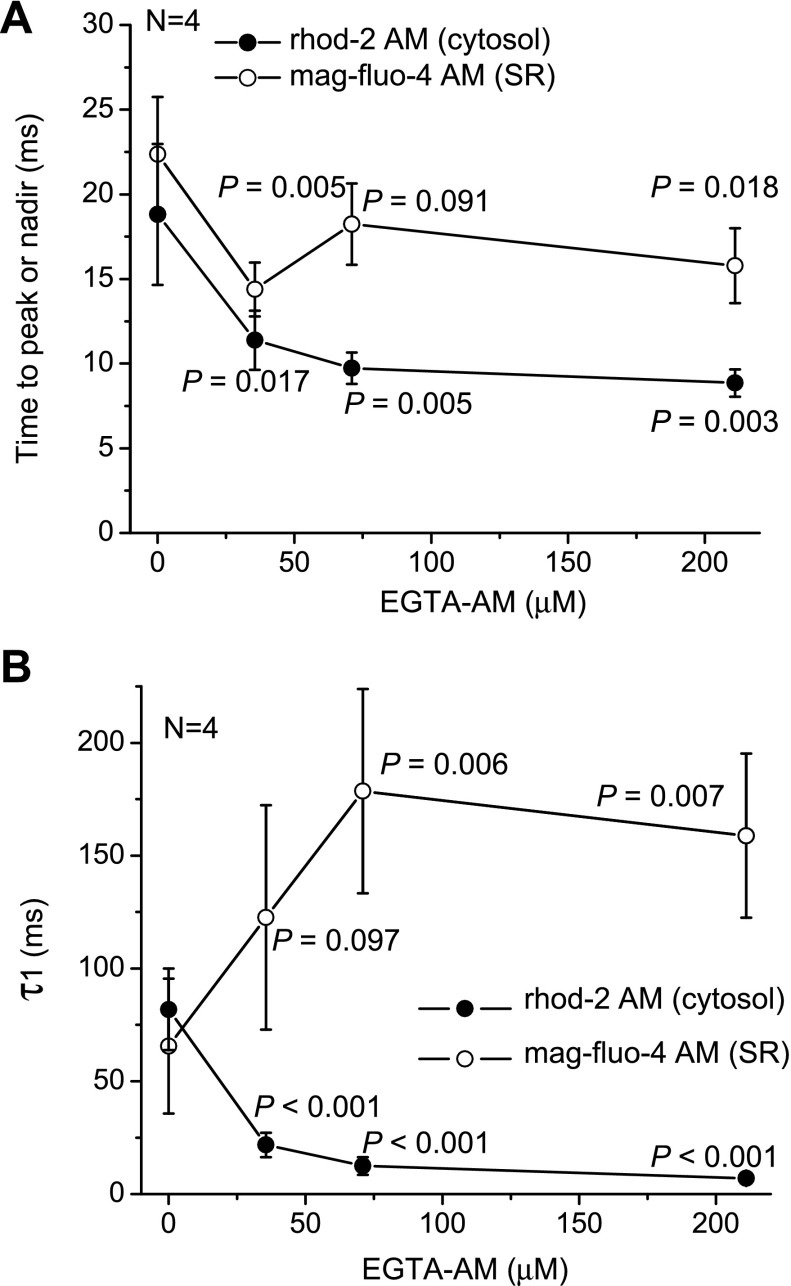
Fig. 7.
Changes in the kinetics of Ca2+ transients in the cytosol (●) and Ca2+ depletion in the SR lumen (○) as a result of increasing the EGTA AM concentration in the loading solution. A and B: time to peak (A) and faster time constant (τ1; B) obtained as a result of the fitting with a two-exponential decay function. Measurements were conducted at 37°C and at a pacing frequency of 2 Hz. Data are means ± SD; N is the number of independent experiments (4 for each combination of dye and EGTA AM concentration, total number: 32). P values are results of one-way ANOVA (no EGTA AM vs. different concentrations of EGTA AM).

