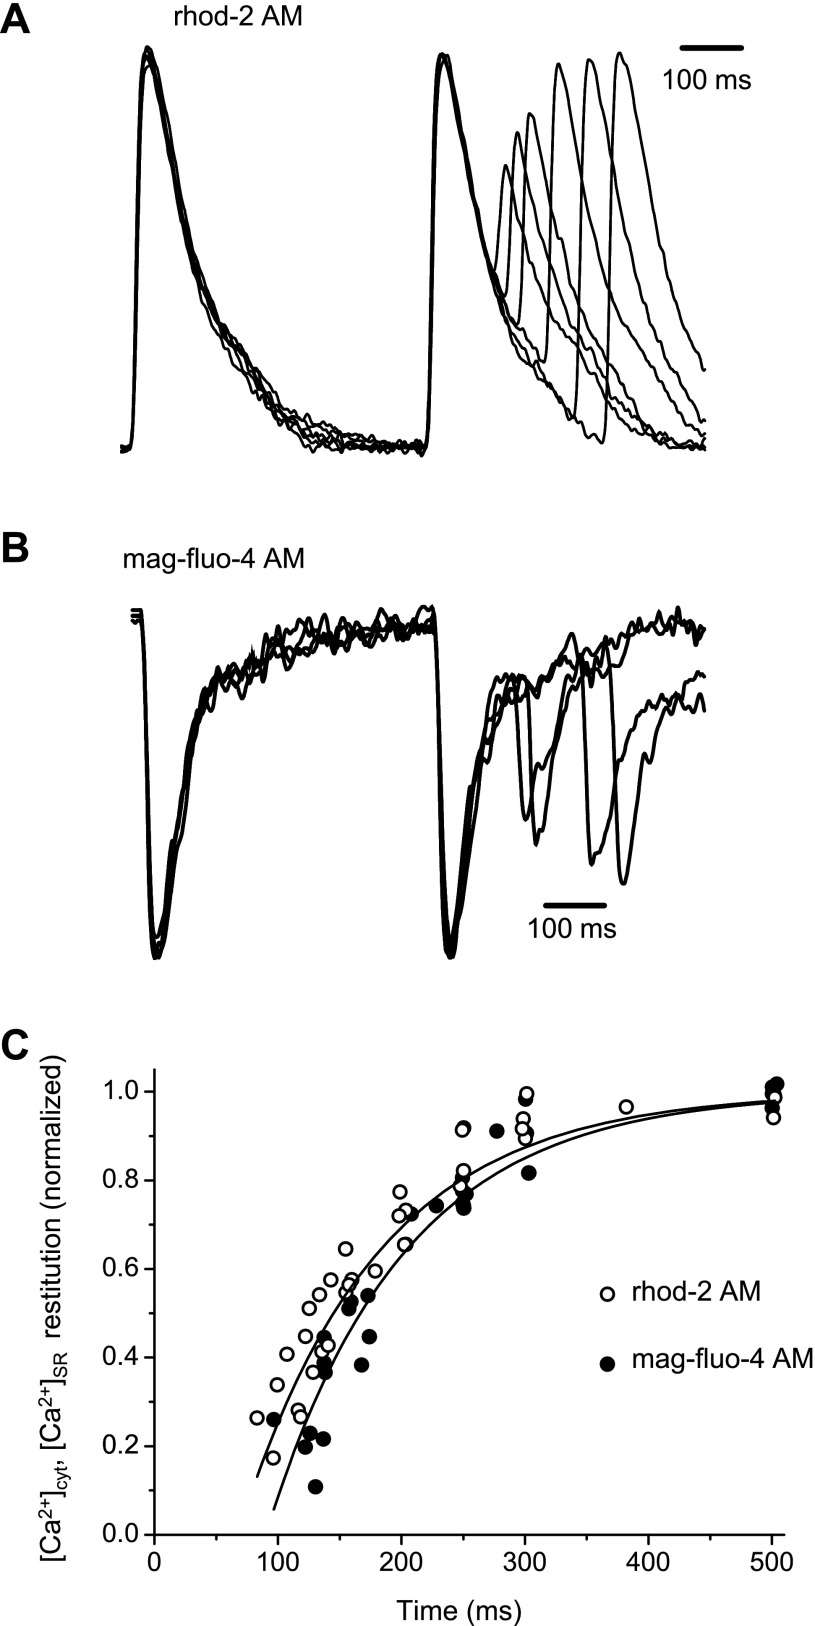
Fig. 8.
Typical traces obtained during the measurement of restitution of Ca2+ transients in the cytosol (A) and Ca2+ depletions in the SR lumen (B). Changes in cytosolic and SR Ca2+ concentrations ([Ca2+]cyt and [Ca2+]SR, respectively) were normalized to the amplitude of the first peak, and the normalized traces were then superimposed. C: comparison of the time courses of restitution of Ca2+ release in the cytosol and Ca2+ depletion in the SR (N = 8, 4 heart preparations for each dye). Recordings were conducted at 37°C and at a pacing frequency of 2 Hz. No EGTA was added into the loading solution.

