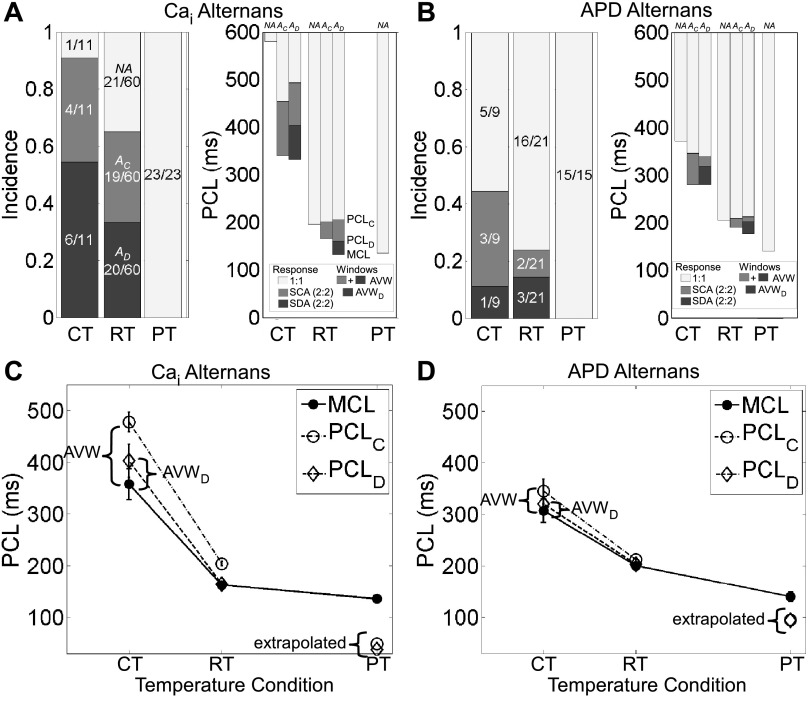
Fig. 3.
Summary of Cai2+ and APD alternans at different temperature conditions. A and B: Cai2+ alternans (A) and APD alternans (B) at physiological temperature (PT), room temperature (RT), and cold temperature (CT). Left: light shaded regions show the incidence of monolayers with no alternans (NA monolayers), medium shaded regions show the incidence of monolayers with spatially concordant alternans (AC monolayers), and dark shaded regions show the incidence of monolayers with spatially discordant alternans (AD monolayers). Values in bars are numbers of monolayers. Right: plot of PCL showing the transitions from the window of 1:1 response (light shaded regions) to the windows of 2:2 response, consisting of regions of spatially concordant alternans (SCA; medium shaded regions) and spatially discordant alternans (SDA; dark shaded regions). These regions, in turn, define the alternans vulnerable window (AVW; medium and dark shaded regions together) and spatially discordant alternans vulnerable window (AVWD; dark shaded region). Error bars are not shown but are given in Supplemental Tables S1–S3. C and D: plots of mean PCLC, PCLD, and MCL for Cai2+ (C) and APD (D) alternans. Solid lines connect measured values of MCL, and dashed lines connect measured values of PCLC and PCLD. Extrapolated values for PCLC and PCLD, determined from Q10 values and Eq. 1, are plotted for PT. Error bars show SEs.

