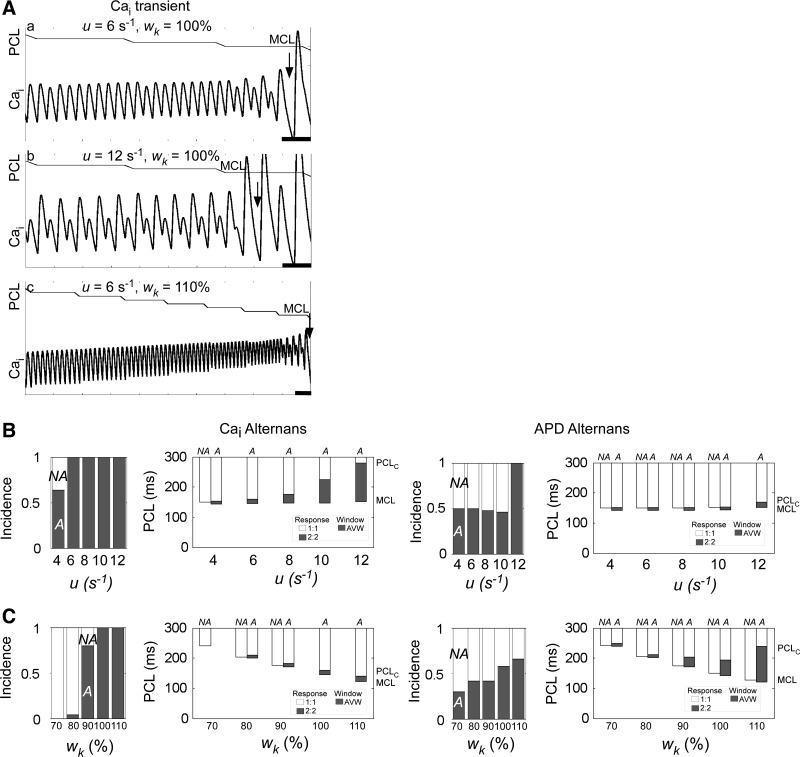
Fig. 4.
Alternans incidence and vulnerable window in a computational model. A: Ca2+ transients during decremental pacing to MCL for three combinations of the sensitivity of sarcoplasmic reticulum (SR) Ca2+ release to SR load (i.e., the gain; u) and the relative weight of K+ ionic current (wK). The traces at the top of a–c show PCL as a function of time. Loss of 1:1 or 2:2 capture (MCL) is shown in each trace (arrow). a–c start at the same instant of time, but c is shown for 5 s longer. Ca2+-dependent inactivation parameter of the L-type Ca2+ channel (γ) = 1.0. Scale bars = 500 ms. Transmembrane voltages were also computed and had similar results (not shown). B: effects of varying u on the incidence and onset of Cai2+ and APD alternans. Increasing u increased the incidence of Cai2+ and APD alternans (left) and also increased PCLC and, to a lesser extent, MCL, with a net effect of an overall increase in AVW (right). γ = 1.0 and wK = 100%. C: effects of varying wK on the alternans incidence and onset. Increasing wK increased the incidence of Cai2+ and APD alternans (left) and decreased MCL and, to a lesser extent, PCLC, with a net effect of an overall increase in AVW (right). u = 6 s−1. In B, right, and C, right, the left (or right) column of a given pair is average for NA [or alternans (A)] cells. In cases of 0% (or 100%) incidence of alternans, only the NA (or A) columns are shown. Error bars are not shown, but in all cases, SEs were <2 ms.

