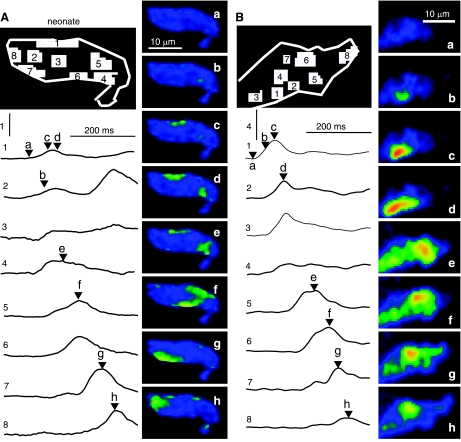
Fig. 7.
Spatial analysis of IP3-mediated Ca2+ signaling events in permeabilized neonatal (A) and juvenile (B) cardiomyocytes. Each panel shows a map that identifies 8 regions of interest, 8 traces (1–8) showing the time course of the fluorescence changes in these regions, and 8 normalized fluorescence images (a–h) that were measured at the times indicated by letters and arrow heads next to the traces. The vertical scale bars indicate ΔF/F0 values of 1 (A) or 4 (B; 20 μM IP3; permeabilized cells; same color scale as Fig. 1).

