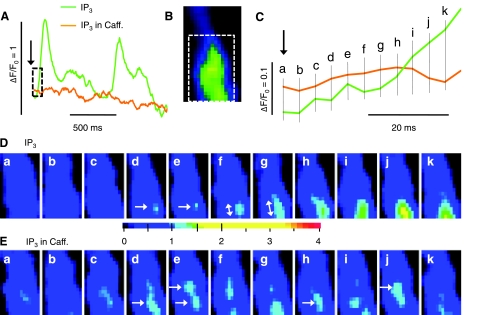
Fig. 8.
Time course of local IP3-activated Ca2 signal before and after depletion of the RyR-gated Ca2+ stores. A: cellular Ca2+ changes (ΔF/F0) upon extracellular application (arrow) of 20 μM IP3 before (green) and after (orange) 3-min incubation with 10 mM caffeine. The boxed regions of the traces and of the sample frame (B) were expanded to show details of the onset of the IP3-induced responses on an expanded time scale (C) and as rapidly changing normalized fluorescence images recorded at 240 frames/s (D and E) at the times indicated in C (permeabilized juvenile cardiomyocyte; expanded color scale).

