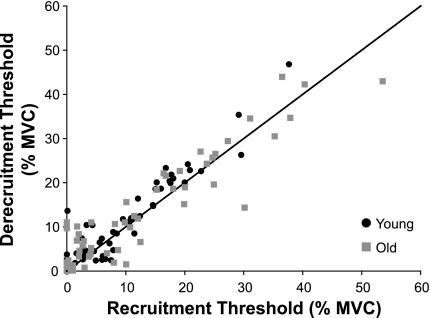
Fig. 4.
Derecruitment threshold force of motor units plotted as a function of recruitment threshold force for young and old adults. Clustering of the data points around the line of identity indicated that derecruitment thresholds were similar to recruitment thresholds for both young (P = 0.127) and old adults (P = 0.334). Derecruitment threshold was linearly associated with the recruitment threshold for both young (r2 = 0.89; y = 1.07x + 0.896) and old adults (r2 = 0.87; y = 0.871x + 2.29; P ≤ 0.001).

