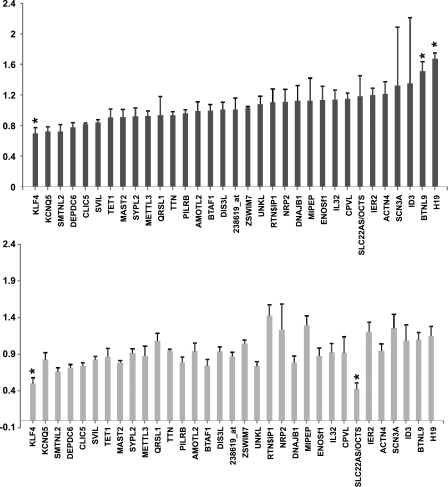
Fig. 3.
Skeletal muscle expression of all the predictor genes (based on RNA), which together explain ∼58% of the variance in exercise training-induced changes in V̇o2max in young sedentary human subjects (n = 24) before and after 6 wk of aerobic exercise training. Top: high responders following 6 wk of aerobic training; bottom: low responders following 6 wk of aerobic training. Expression values are generated using Affymetrix U133 Plus 2.0 gene chips (>47,000 transcripts), normalized using MAS5.0, and corrected for multiple comparisons using the significance of microarrays analysis methodology. This analysis strategy avoids issues with unstable housekeeping genes. Only H19, KLF4, OCT3, SMTNL2, and BTNL9 demonstrated a modest change in expression below a false discovery rate of 5% (∗), and not consistently in high and low responders. All other genes (>90% of predictor genes) were unchanged.

