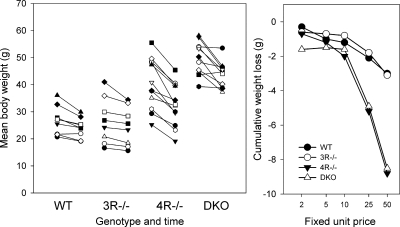
Fig. 3.
Weight changes of mice during the demand series. Left: weights are shown of individual mice (different symbols) of each genotype at the beginning of the study (first 2 days of FUP2), and at the end of the study (last 2 days of FUP50). The lines thus join the start and end weights for each mouse. Right: as group means, the cumulative body weight changes from initial weight until the end of each demand schedule are shown.

