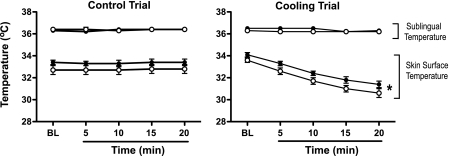
Fig. 1.
Sublingual and mean skin surface temperature responses to control (left; 5 young and 5 older) and cooling (right; 11 young and 11 older) trials in young (●) and older adults (○). Data are presented at baseline (BL) and minutes 5, 10, 15, and 20 of the respective intervention. Values are means ± SE. *P < 0.05 main effect of the intervention in young and older groups.

