Fig. 2.
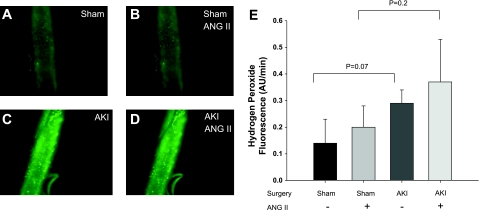
AKI induces alterations in hydrogen peroxide levels in GA, which were incubated with dichlorofluoroscein and evaluated via fluorescent microscopy. Representative fluorescent images were obtained from vessels derived from sham-operated rats (A and B) and post-AKI rats (C and D). Images were also evaluated prior to (A and C) and following (B and D) stimulation with ANG II (10−8 M). E: summarized data describing the rate of accumulation of peroxide production in AU of fluorescent intensity per minute. Values are means ± SE. There were no differences between groups.

