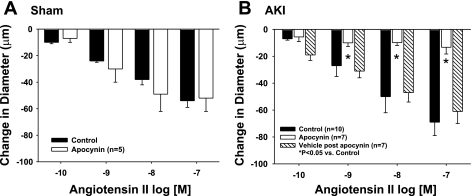
Fig. 4.
Effect of AKI on ANG II-induced constriction and the effects of apocynin in isolated GA from postischemic rats. Response to increasing levels of ANG II are shown (white bars) or with increasing levels of ANG II and the NADPH oxidase inhibition with apocynin (1 μM, black bars). Results are shown for vessels obtained from sham-operated controls (A) and post-AKI animals (B). Stippled bars in B represent the restored activity following washout of apocynin, demonstrating restoration of the ANG II response. Data are means ± SE expressed as the absolute change from baseline. *Significant difference from vehicle (n = 4; P < 0.05).

