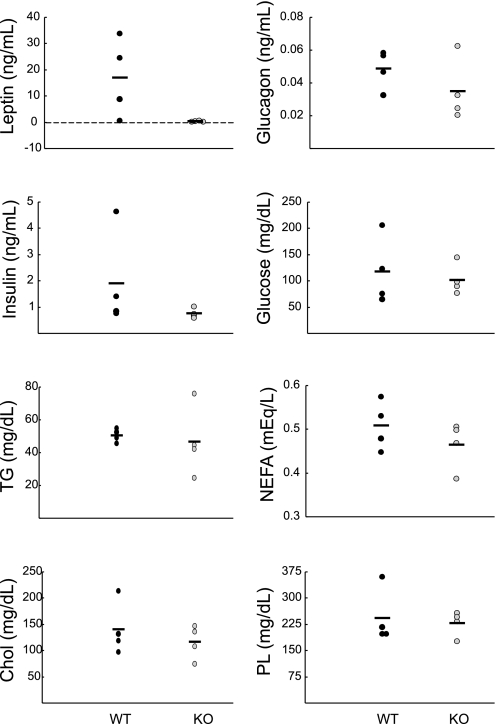
Fig. 8.
Plasma profile of WT and KO mice on a high-fat diet. Plasma hormone and lipid levels from unfasted female WT (black circles, n = 4) and KO mice (grey circles, n = 4) that had been on a high-fat diet for 4 mo were measured. Due to the high variability, neither the differences in leptin nor insulin levels achieved statistical significance. Levels of TG, NEFA, Chol, and PL were normal in mutant mice.

