
Figure 2.
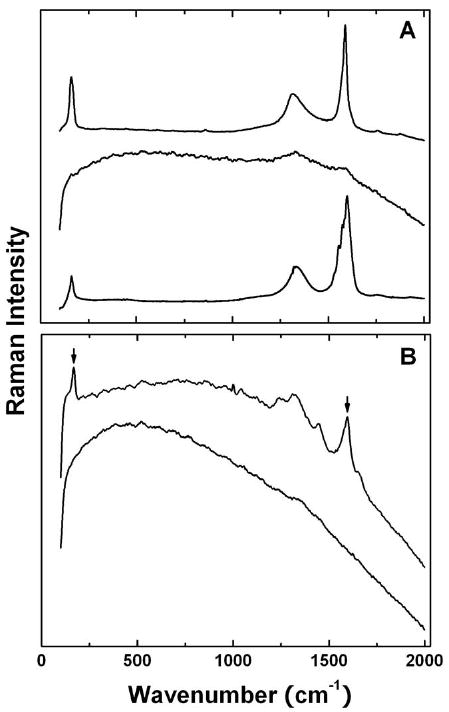
(A) Raman spectra of pre-functionalization SWNTs (bottom), PEG-SWNT (middle), and the chemically defunctionalized sample (top); (B) Raman spectra of the liver homogenate with PEG-SWNT (bottom) and the chemically defunctionalized PEG-SWNT (top, with the RBM band and G-band marked).