Figure 3.

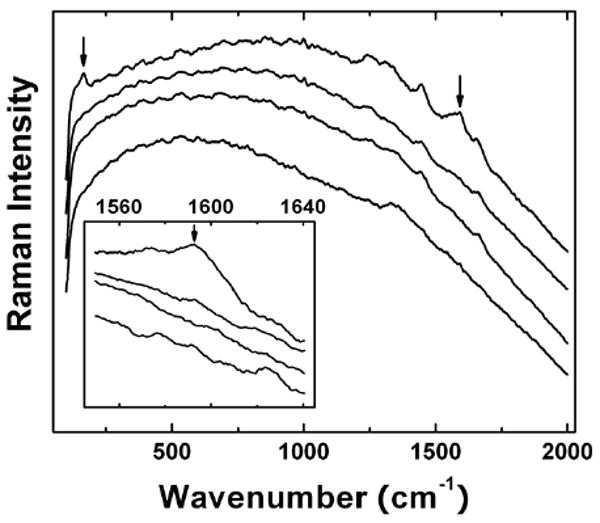
Raman spectra (the inset featuring the region around 1,600 cm-1) of the liver samples harvested from the PEG-SWNT-administrated mice (from bottom up: the control, 1 day, 1 week, and 4 weeks post-exposure).

Raman spectra (the inset featuring the region around 1,600 cm-1) of the liver samples harvested from the PEG-SWNT-administrated mice (from bottom up: the control, 1 day, 1 week, and 4 weeks post-exposure).