
Figure 3.
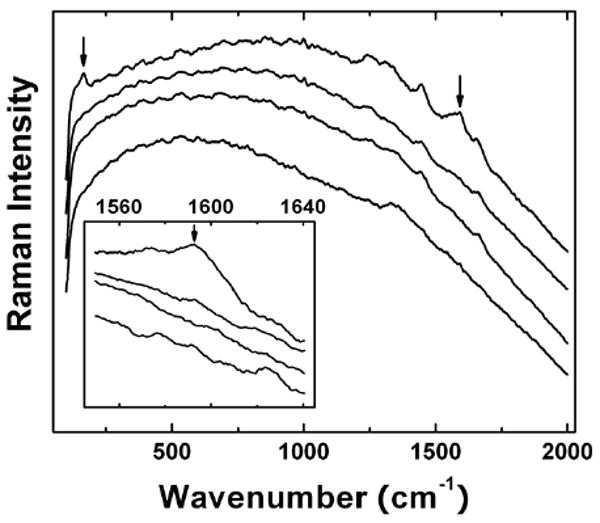
Raman spectra (the inset featuring the region around 1,600 cm-1) of the liver samples harvested from the PEG-SWNT-administrated mice (from bottom up: the control, 1 day, 1 week, and 4 weeks post-exposure).
Official websites use .gov
A
.gov website belongs to an official
government organization in the United States.
Secure .gov websites use HTTPS
A lock (
) or https:// means you've safely
connected to the .gov website. Share sensitive
information only on official, secure websites.
Raman spectra (the inset featuring the region around 1,600 cm-1) of the liver samples harvested from the PEG-SWNT-administrated mice (from bottom up: the control, 1 day, 1 week, and 4 weeks post-exposure).