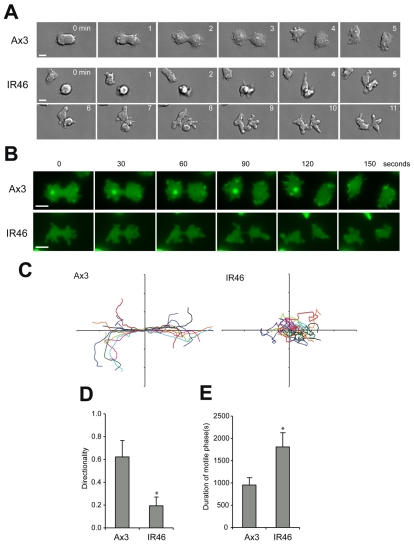
Fig. 3.
Abnormal mitosis of Dictyostelium cells lacking SCAR. (A) DIC images of control (Ax3) and scar-null (IR46) cells dividing on a glass surface. (B) Wide-field fluorescence images of dividing cells expressing GFP-actin. Scale bar: 10 μm. Note the lack of MiDASes and cortical actin in IR46 cells. (C) Plot indicating the paths of cells at cytokinesis. Movies of dividing cells were orientated such that the furrow was formed perpendicular to the x-axis and the centroids of the daughter cells were tracked manually from the first frame at which the furrow could be seen. Ten divisions of each cell line are superimposed; the paths of each pair of daughter cells are same colour. (D) Directionality of the cell paths plotted in C. (E) The duration of the motile phase, from the initiation of furrowing to a return to interphase morphology and behaviour (i.e. random migration and the cessation of blebbing). Values are the means ± standard deviation of 20 cells from 10 divisions. *P<0.005, Students t-test.

