Fig. 7.
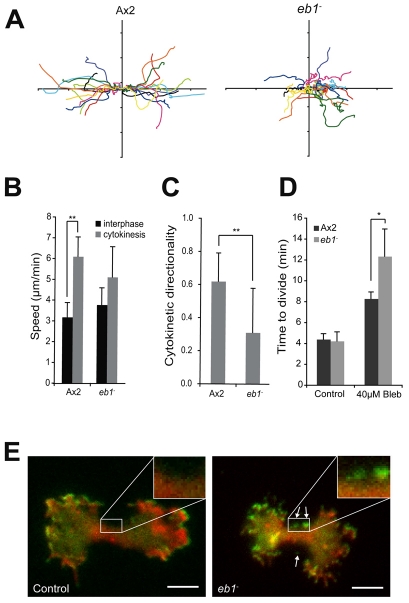
EB1 directs post-mitotic migration. (A) Paths of control (Ax2) and eb1-null cells at cytokinesis. Ten divisions are superimposed and the plots for each pairs of daughter cells are same colour. (B) Speed of migration of both dividing and interphase cells and (C) Cytokinetic directionality (defined as the distance moved perpendicular to the furrow divided by the total path length) of mutant cells. (D) Time to complete division, from the initiation of furrowing to abscission of control (Ax2) and eb1-null cells after treatment for 1 hour with 40 μM blebbistatin. *P<0.01; **P<0.05, Student's t-test. (E) TIRF images of cells coexpressing HSPC300-GFP (green) and mRFPmars-actin (red). Scale bar: 10 μm. Arrows indicate regions where SCAR is inappropriately localised in eb1-null cells (for the full sequence see Movie 10 in supplementary material).

