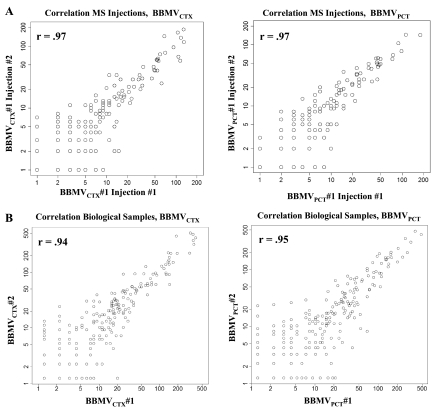
Fig. 5.
Scatterplots of total SpC in replicate samples. A: correlation of total SpC between replicate injections. Pearson's product indicated a correlation of r = 0.97 between typical examples of replicate injections. B: correlation of total SpC between biological replicates. Pearson's product indicated correlations of r = 0.94 and r = 0.95 between the replicate BBMVCTX and BBMVPCT samples, respectively.

