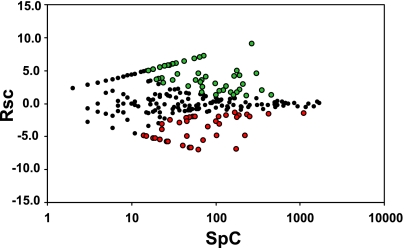
Fig. 6.
Statistical analysis of differences in abundance of the proteins identified in the BBMVCTX and BBMVPCT samples. The analysis is illustrated as a plot of log2 of the normalized ratio of SpC (RSC) vs. the total SpC for all of the identified proteins. Green and red circles represent proteins that are significantly increased in either the BBMVPCT or BBMVCTX samples, respectively. Black circles represent the remaining proteins that are not different in the 2 samples.

