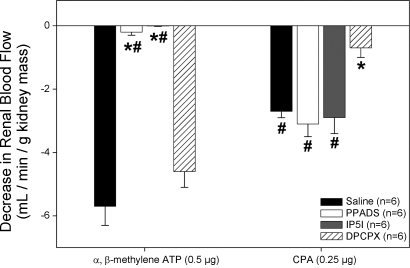
Fig. 5.
Confirmation of P2X1 and A1 receptor blockade following autoregulatory curves. Change from baseline RBF immediately preceding α,β-methylene ATP and CPA injections in saline vehicle (filled bars)-, PPADS (open bars)-, P1,P5-Di-inosine-5′-pentaphosphate pentasodium salt (IP5I; gray bars)-, and DPCPX (cross-hatched bars)-infused rats. *P < 0.05 vs. vehicle-infused rats. #P < 0.05 vs. DPCPX-infused rats.

