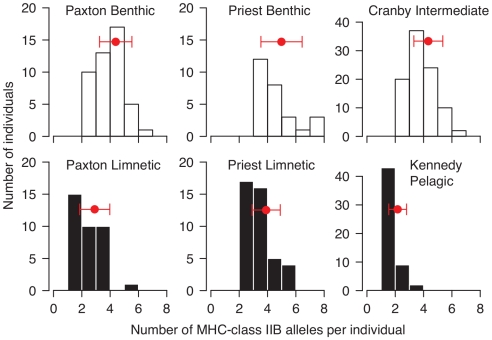
Figure 1. Frequency distributions of the number of MHC-class IIB alleles per individual.
The top panels show the distribution of littoral and intermediate eco-types, and the bottom panels show the distribution of pelagic eco-types. Red points and bars indicate the mean population allelic richness ( SD).
SD).

