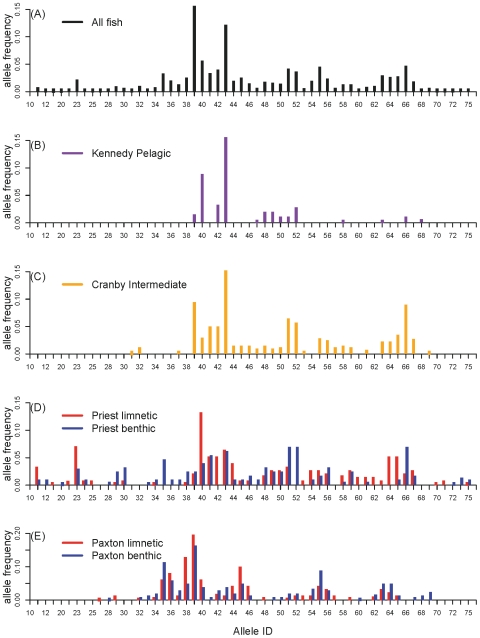
Figure 2. Frequency distributions of MHC-class IIB alleles in each population.
Panel (A) is the distribution for all the alleles identified in the study. Panel (B) is the distribution for the pelagic phenotype in Kennedy Lake. Panel (C) is the distribution for the intermediate phenotype in Cranby Lake. Panels (D) and (E) are the distributions for each stickleback species in the two lakes with species pairs.

