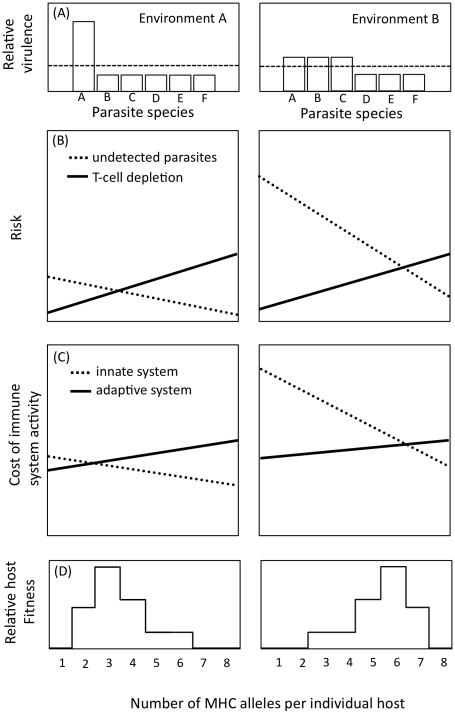
Figure 5. Two scenarios leading to divergent selection on MHC genotype.
Panel (A) shows the contrasting virulence distribution of two parasite communities, where the dotted line indicates that the average virulence of the community is similar in both environments. Panel (B) shows the tradeoff between the ability of the immune system to detect parasites (dotted lines) and the risk of T-cell depletion (solid lines). Panel (C) shows the tradeoff between allocating resources to the adaptive versus the innate immune system. Panel (D) illustrates the resulting population distribution of individual allele number in the two environments (A or B) resulting from divergent selection mediated by either of the tradeoffs illustrated in Panel B and C.

