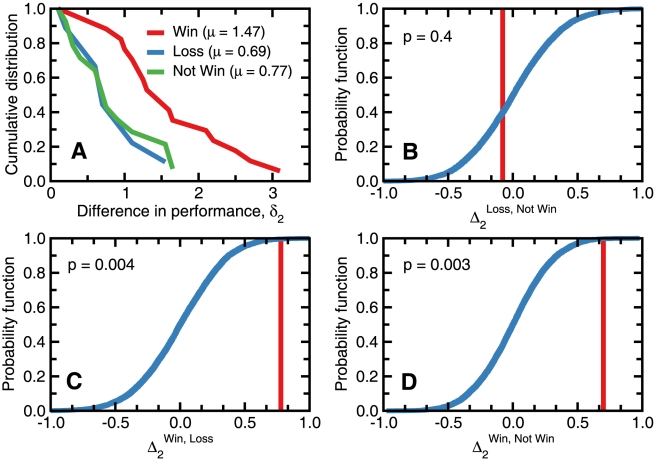
Figure 2. Validity of the flow centrality metric.
We define team performance  as the mean normalized log flow centrality of the
  top players in a team. (A) Cumulative distribution of
  for matches where the team with highest performance wins, loses, or “not wins”. Clearly, the mean
  is much larger for games in which team with the highest performance wins. We use Monte Carlo methods with boostrapping to determine the significance of the differences in means for the different match outcomes. The red lines indicate the observed difference in
  whereas the blue curves are the distribution of measured differences for the null hypothesis. (B) We find that there is no statistically significant difference in
  when comparing “Loss” versus “Not Win” outcomes. In contrast, we find highly significant differences when comparing (C) “Win” versus “Loss” or (D) “Win” versus “Not Win”.

