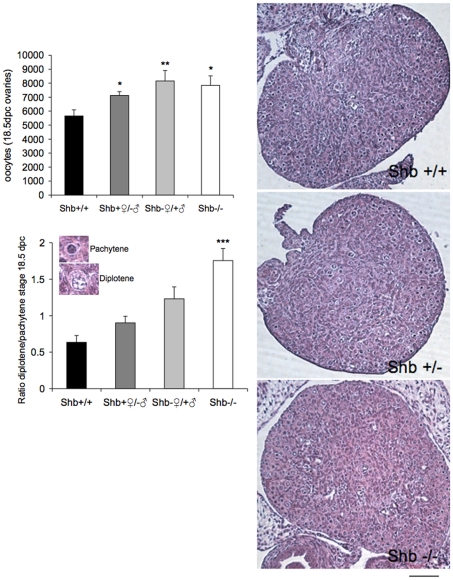
Figure 1. Number of primary oocytes and relative degree of maturation in fetal ovaries (18.5 dpc).
Ovaries were subjected to morphological analysis determining oocytes in the pachytene and diplotene stages. Representative images of oocytes and ovaries are included in the figure (scale bar indicates 100 µm). Values are for four genotypes including Shb +/− (wild-type mother) and Shb −/+ (wild-type father). Means ± SEM for n = 5 (+/− and −/+) and n = 10 (+/+ and −/−) ovaries. *, ** and *** indicate p<0.05, 0.01 and 0.001, respectively, compared with wild-type control by ANOVA (Fisher LSD test).

