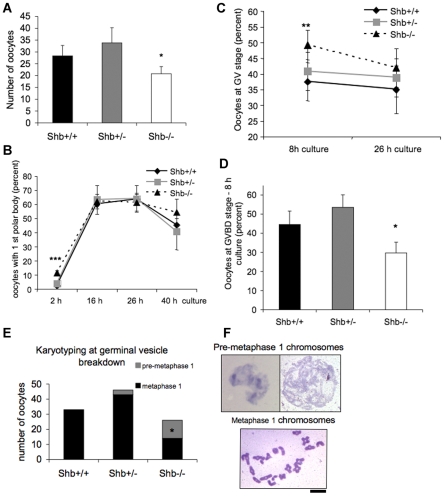
Figure 5. Oocyte maturation and chromosome karyotyping.
Oocytes were mechanically recovered from ovaries 42 h after PMSG injection followed by culture for 2, 8, 16, 26 and 40 h. In A, the number of retrieved oocytes is given. B shows polar body extrusion. C depicts the percentage of oocytes in the GV (germinal vesicle) stage and D the corresponding GVBD (germinal vesicle breakdown) values. E shows the quantification of chromosomal characteristics after karyotyping at the GVBD stage and F provides representative images of such chromosomal preparations. Means ± SEM per mouse for n = 15 in A are given. In B, n = 11 at 2 h, n = 6 at 26 hours and n = 3 at 16 and 40 h. * and *** indicate p<0.05 and p<0.001, respectively, when compared with wild-type control using a Wilcoxon signed rank test. In C and D, means ± SEM for n = 11 at 8 hours and n = 5 at 26 hours. * and ** indicate p<0.05 and 0.01, respectively compared with wild-type control using a paired t-test. In E, the number of oocytes karyotyped from 5 separate experiments is given, including those in metaphase MI and pre-metaphase MI. * indicates p<0.05 when compared with wild-type control using a Chi-square test. Scale bar indicates 10 µm.

