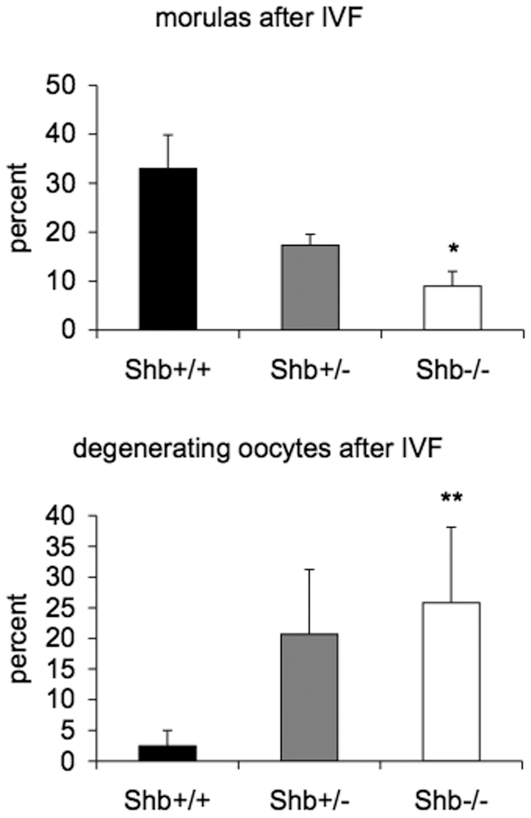
Figure 6. Embryo development after in vitro fertilization.
Fertilized oocytes developing to the morula stage and those undergoing degeneration were scored as percentages in each group of collected oocytes. Means ± SEM in four separate experiments are given. * and ** indicate p<0.05 and 0.01, respectively when compared with wild-type control using a paired Student's t-test.

