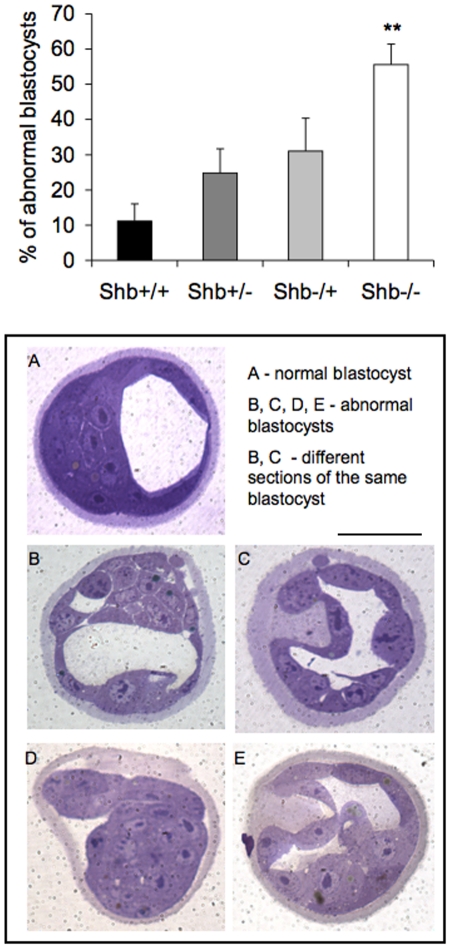
Figure 7. Blastocyst morphology at 3.5 dpc.
Percentage abnormal embryos was determined in each litter and expressed as means ± SEM for five experiments. +/− is wild-type mother and −/+ is wild-type father. ** indicates p<0.01 when compared with wild-type control using Student's t-test with Bonferroni correction. A shows wild-type blastocyst, B-E Shb −/− blastocysts. Scale bar indicates 100 µm.

