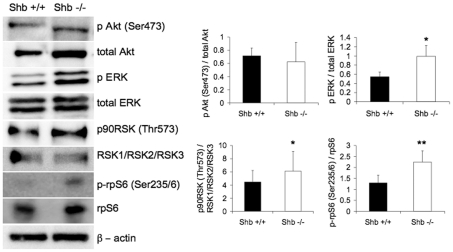
Figure 8. Akt, ERK, RSK and rpS6 activities/phosphorylation.
Oocytes were isolated from neonatal Shb +/+ and −/− mice and subjected to Western blot analysis. Phosphorylation was related to total protein content on the same blot and determined by densitometric analysis. Values are arbitrary units expressed as means ± SEM. n = 3 for RSK, n = 4 for Akt, n = 5 for ERK and n = 6 for rpS6. * and ** indicate p<0.05 and 0.01, respectively using a paired t-test.

